AX Performance Monitor 101 - Setup Perfmon for Continuous Monitoring with Rolling Files [ENG]
Table of Contents
Windows Performance Monitor (PerfMon) is likely the most useful tool (together with our DynamicsPerf package) to monitor and diagnose performance problems related with your Microsoft Dynamics AX infrastructure and, in general, for any software running on Windows operating systems. Given its importance, is surprising how many people is not using it properly or, even worst, is not using it at all.
I will briefly explain how to setup PerfMon to collect performance counters in all servers for continuous monitoring, creating log files per day, compressing and deleting old files to minimize disk space, along with some tips and tricks during the process:
Create and configure a Data Collector Set
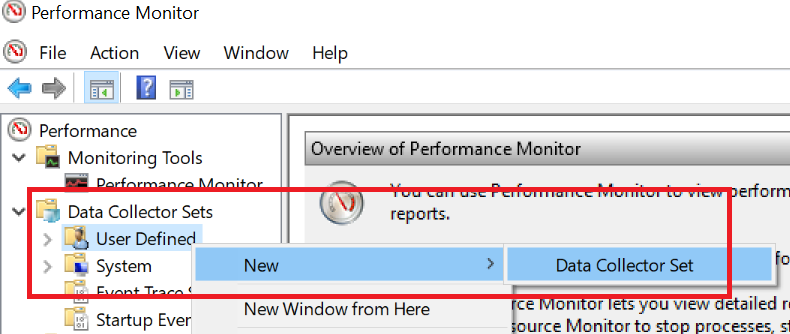
- First of all open Performance Monitor either going to Administrative Tools in Windows Control Panel or searching “perfmon” in the Start menu.
- Navigate to Data Collector Sets > User Defined > Right Click > New > Data Collector Set.
- Choose “Create from a template” and finish the wizard. Some nice templates for all Dynamics AX server roles can be obtained as part of our DynamicsPerf download, under “DynamicsPerf 2.00\DynamicsPerf\Windows Perfmon Scripts” subfolder or as part of the PAL tool. We will talk about PAL on the next post on this series.
Adjust the Data Manager properties to keep disk space under control
Now that our Data Collector Set is created, let’s make some adjustments on how data is saved to disk so we can optimize disk space used.
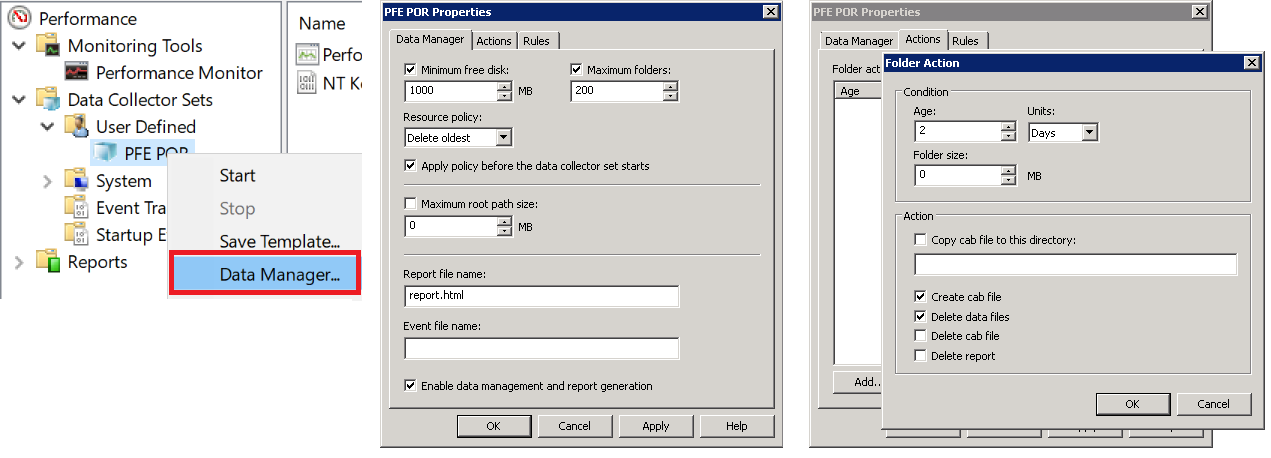
- Right click the newly created Collector Set and select Data Manager (see next screenshot).
- Adjust Data Manager tab options as needed, depending on server role and disk size available, these are some tips to start with:
- Minimum free disk: Specify the minimum amount of disk space needed to avoid impacting performance (this value should never be used, but setup some value just to be safe).
- Resource policy: Delete oldest
- Check Apply policy before the data collector set starts
- Check Enable data management and report generation
- Switch to Actions tab and Add two different actions with the following values:
- Action 1:
- Condition: 2 Days
- Actions:
- Create cab file
- Delete data files
- Action 2:
- Condition: 1 Week
- Actions:
- Delete data files
- Delete cab file
- Delete report
- These values can be of course adapted as needed. For example, an extra action can be added to allow reports to be stored longer (using the Delete report option in the form), or conditions can be adjusted to keep more or less historic data as needed:
- Action 1:
- When you have your actions ready, click OK to close Data Management properties.
Setup scheduled triggers to create a log every day
Now we need to ensure that a new file is created every day (period can be adjusted too) and only one monitor instance is running at a time:
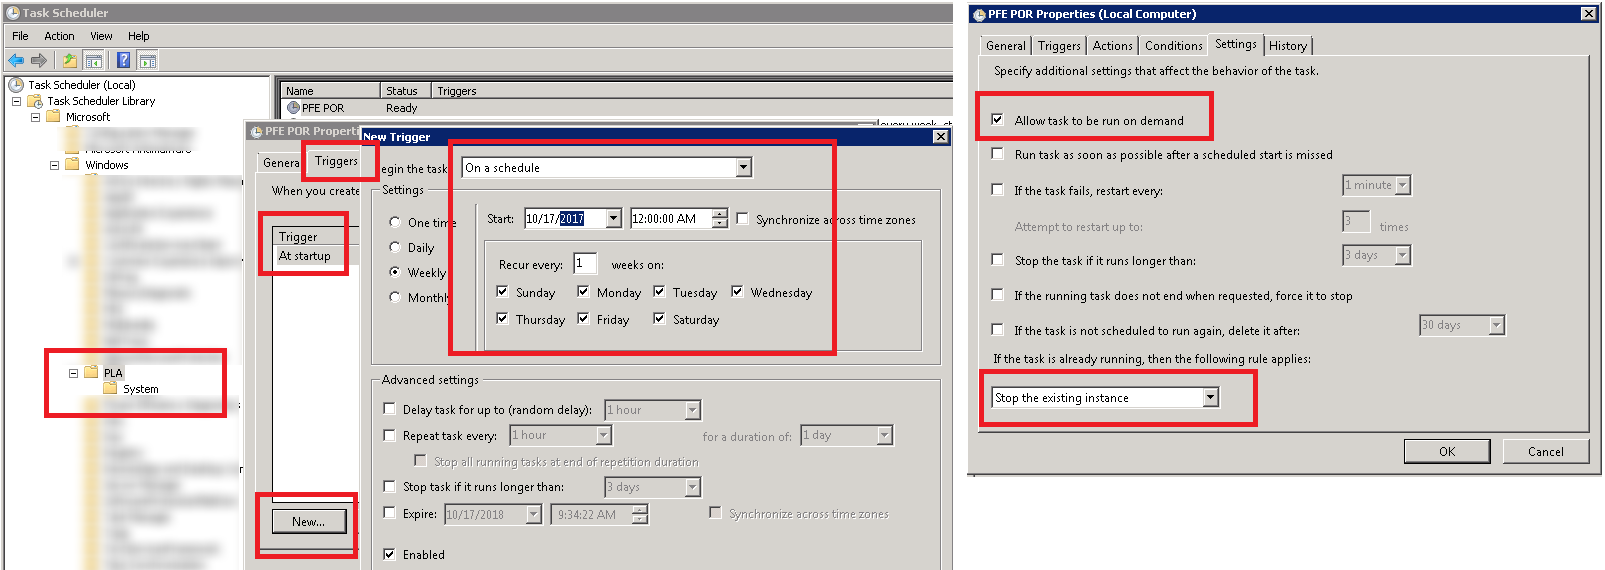
- Open Task Scheduler in Windows (easier way is to search “taskschd” in the Start menu) and navigate to Task Scheduler Library > Windows > PLA. There should be a scheduled task already created with the same name than our Data Collector Set (see next screenshot).
- Right click this scheduled task and select Properties.
- Switch to the Triggers tab and create two new triggers by using the New button
- Startup trigger, use the following values:
- Begin the task: When the system starts
- Enabled: true
- Let the rest of values by default (unchecked)
- Daily trigger, use the following values:
- Begin the task: On a schedule
- Settings: Daily
- Adjust time to 12:00:00AM (or 00:00:00). This can be changed if more than one file should be created per day, but daily is usually a good starting point.
- Enabled: true
- Let the rest of values by default (unchecked)
- Startup trigger, use the following values:
- Switch to the Settings tab and use the setting provided in the screenshot:
- Allow task to be run on demand
- If the task is already running, then the following rule applies: Stop the existing instance
With this setup, every day at 00:00:00 a new instance of the Performance Monitor will be triggered by the scheduler, stopping the existing one and triggering the Data Management options to compress the current file, creating a report and deleting old historic files. In the event of a server restart, a new instance will be triggered on startup and a new log file will be created to avoid any data loss in the logs (thanks to the Server & Tools PFE team for this tip!).
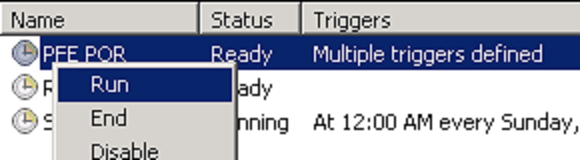
This setup is flexible enough to be adapted depending on disk space, historical data requirements and server workload, and of course these parameters can be different by server role. To test that everything is working fine you can wait until 00:00:00, when a new task will be triggered automatically, or the task can be executed manually:
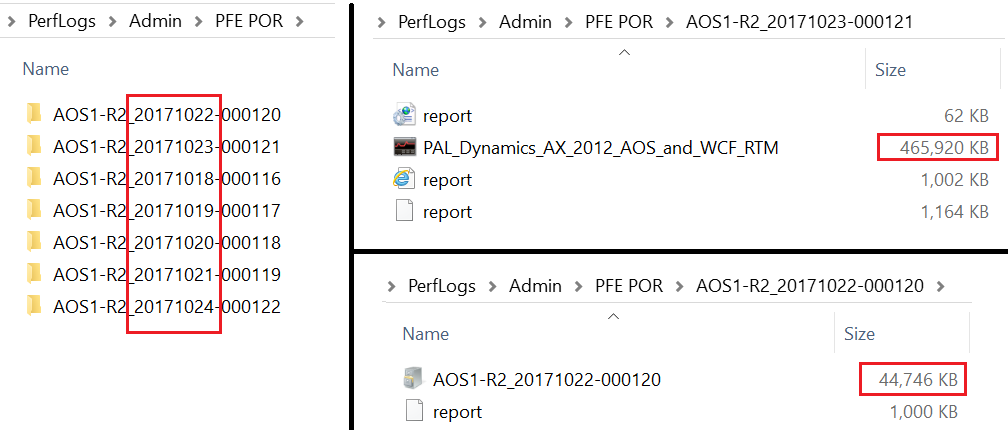
After a couple of days or manual executions, new subfolders will be created per day under the designated root folder, containing either the raw file for the current day, or a compressed CAB file per day for the previous week, depending on the Data Management setup and Scheduled Tasks:
Posts in this series
- AX Performance Monitor 101 - Tips and Tricks to Deal with Performance Counter Files [ENG]
- AX Performance Monitor 101 - Setup Perfmon for Continuous Monitoring with Rolling Files [ENG]