AX Performance Monitor 101 - Tips and Tricks to Deal with Performance Counter Files [ENG]
Table of Contents
In my previous blog post, I explained how to setup Performance Monitor (PerfMon) to proactively capture performance data while cleaning old files to keep disk space under control. This is, let’s say, our ideal scenario, but sometimes setup is not that specific and we need to deal with suboptimal files that contains the performance data we need to analyze:
- We have too many files
- We have too few files
- We have some huge file that makes analysis or processing it too slow
- We have files captured in different languages
Let’s have a brief description on how we can deal with some situations by introducing a couple of small but useful tools:
PAL - Performance Analysis of Logs
PAL is a small but really useful tool created by Clint Huffman that takes one perfmon counter file and creates a nice HTML report with graphs and descriptions that can be used as starting point for performance analysis. It’s not that the tool replaces a manual in-deep analysis of any potential problem, but it helps giving some tips that can be used to start looking for something else.
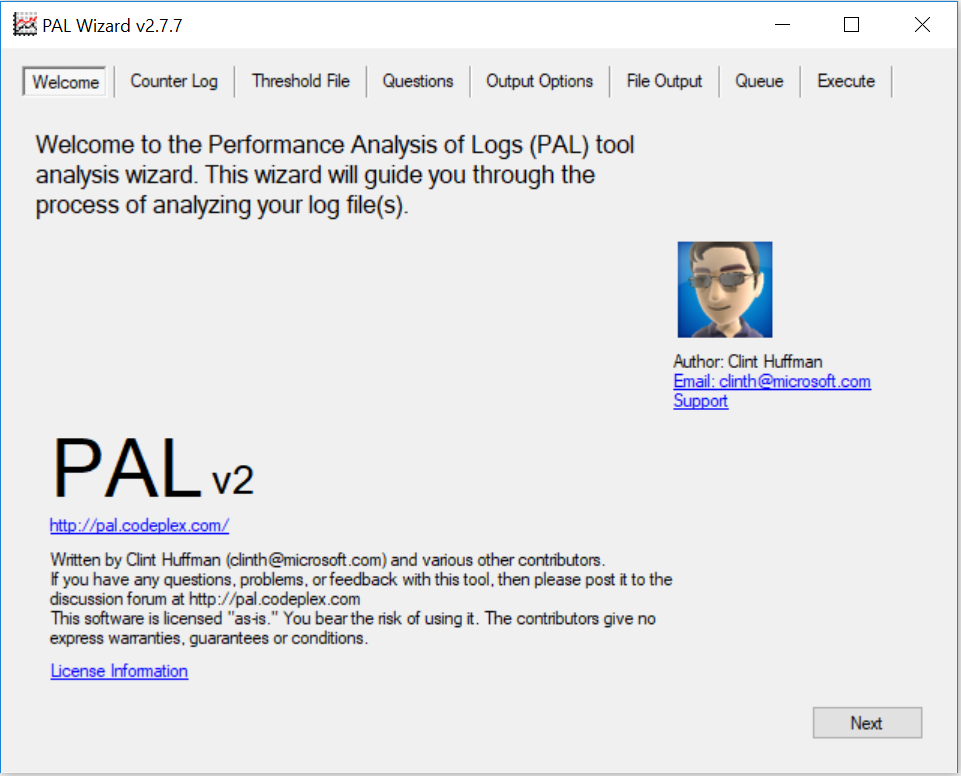
This tool has really interesting options like restrict the analysis to a specific date and time range, or re-sampling the counters to reduce the output length. For instance: if counters are taken every 10 seconds the report may be too large, so it can “slice” it at 30 min or 1-hour intervals (sampling interval is configurable) to make it easier to understand and allowing this report to be easily comparable with reports taken originally with different sampling values. The tool also prepared queue multiple files and let it running until the processing of all of them finished (that can take some hours, depending on the files and setup).
More information and download:
- https://github.com/clinthuffman/PAL (new repository in GitHub)
- https://blog.rmilne.ca/2012/06/26/updated-pal-tool-2-3-1-released/ (how to install and use the tool)
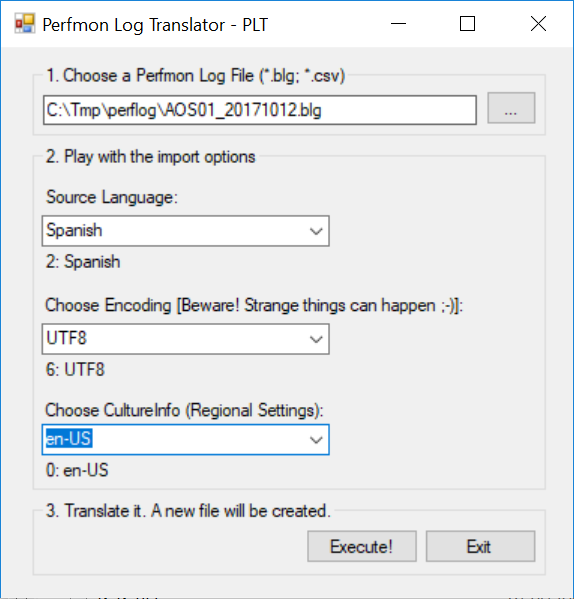
PLT - Perfmon Log Translator
PLT is a small tool that allows you to… well, seems obvious with this name, it translates performance counters between known languages. Not all languages are available, but the tool allows creating new languages files to extend it.
More information and download:
- http://pal.codeplex.com/releases/view/21261 (original source in CodePlex)
- This folder was previously in codeplex but is not yet available in GitHub, I uploaded the last version here.
RELOG
Relog is a standard command-line tool available in Windows operating systems to extract and manipulate performance counters from performance counter logs into other formats or files. Relog is what PAL and PLT are using under the hoods to manipulate the counter files, but it has some interesting options not available on these visual tools. Let’s see some (but not all) situations where relog may be useful:
- We got a huge file taken during several days of data capture for a single server: we can create a new file with a slice of the original file with the date and time range we want to analyze, making it smaller and easier to manage by other tools:
relog "X:\\MIHUGEFILE.blg" -b 05/31/2017 00:00:00 -e 06/01/2017 00:00:00 -o "X:\\ONEDAYFILE.blg"
- We got a lot of files taken with multiple PerfMon templates during different time ranges: we can merge all these files and then cut the output by a specific time range, all in one operation:
relog "X:\\FILE1.blg" "X:\\FILE2.blg" "X:\\FILE2-2.blg" -b 05/31/2017 00:00:00 -e 06/01/2017 00:00:00 -o "X:\\ONEDAYFILE.blg"
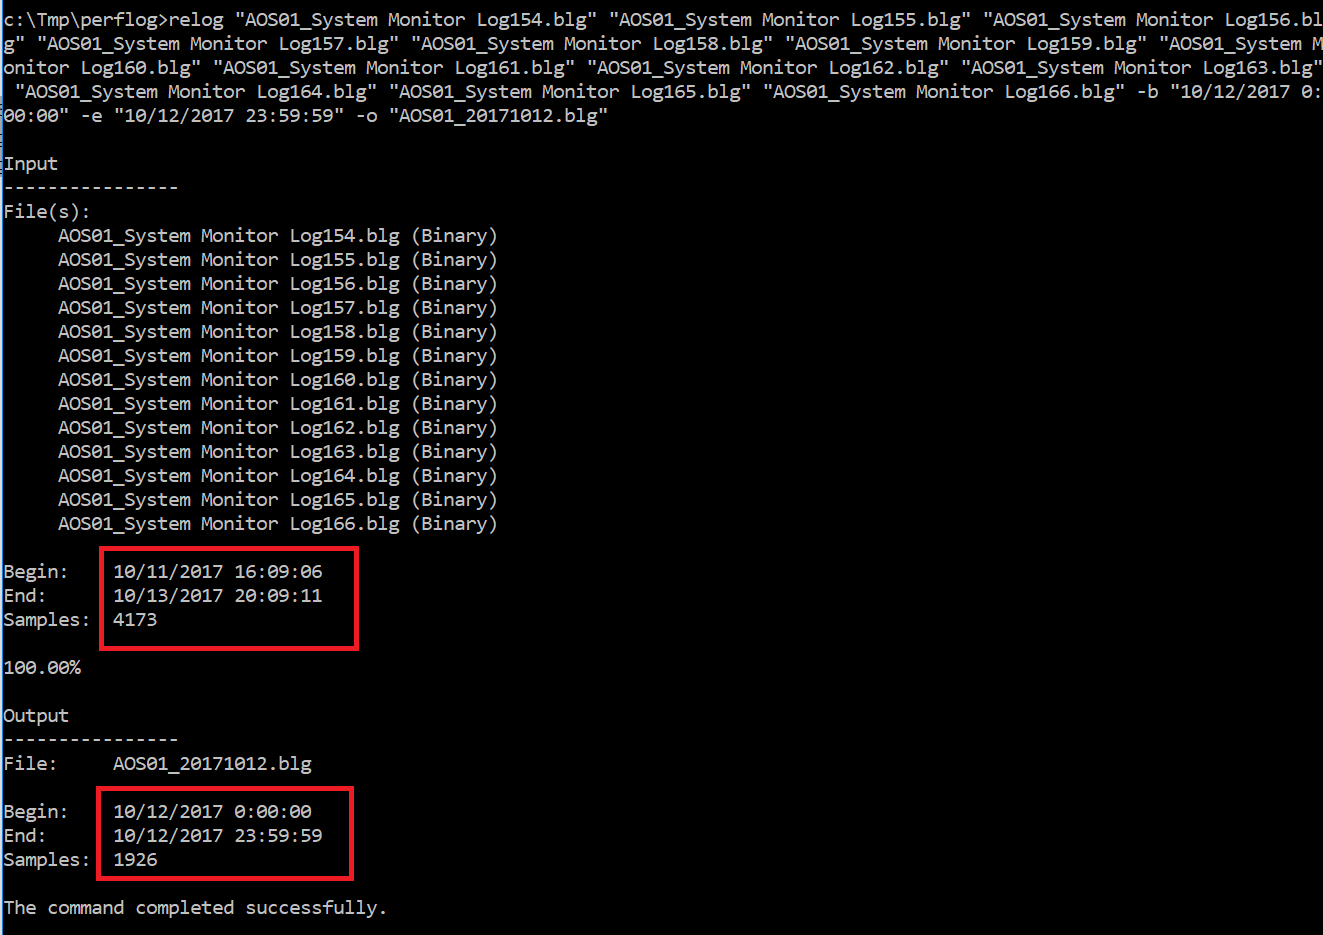
We don’t usually get the counter files in the format or size we want them but we can quickly prepare them with this relog, so we can bypass the limitations of the previous tools. For example, PAL only accepts one file as input for a report and can only analyze English counters. PLT only accepts one file at a time, too. Therefore, creating a single file limited by the date-time range we want to analyze is the first step to PLT (if counters are not in English), and then to PAL.
Check the documentation to see all the options, relog can even save PerfMon counters out to a SQL database!
While out of the scope of this blog series, here are some extra links to learn more about this topic:
- Dynamics AX 2012 Performance Troubleshooting step by step
- Collect AX 2012 event traces with Windows Performance Monitor
- Collect Dynamics 365 for Finance and Operations event traces with Windows Performance Monitor
Posts in this series
- AX Performance Monitor 101 - Tips and Tricks to Deal with Performance Counter Files [ENG]
- AX Performance Monitor 101 - Setup Perfmon for Continuous Monitoring with Rolling Files [ENG]